Риc. 1.
_j_msc_job1_ex.wxmx
| (%i1) | kill(all); |
| (%i1) | load("stats")$ |
| (%i2) | mm:[4.97, 14.9, 6.69, 21.0, 7.94, 11.9, 2.43, 4.43, 0.726, 25.1, 10.5, 15.7, 5.61, 21.2, 18.5, 18.7, 4.66, 28.1, 21.0, 5.06, 15.7, 0.55, 13.9, 1.72, 9.59, 8.92, 16.7, 15.3, 20.5, 12.4]; |
| (%i3) | test_mean(mm,'conflevel=0.95); |
| (%i4) | mean(mm),numer; |
| (%i5) | A:lmax(mm); |
| (%i6) | B:lmin(mm); |
| (%i7) | Rang:A-B; |
| (%i8) | St:Rang/6; |
| (%i10) | s[1]:0; for i:1 step 1 while i<30 do ( if mm[i]<B+St then s[1]:s[1]+1 else s[1]:s[1]); |
| (%i11) | for j:1 step 1 while j<7 do (s[j]:0, for i:1 step 1 while i<30 do ( if mm[i]<B+j*St then s[j]:s[j]+1 else s[j]:s[j])); |
| (%i13) | n[1]:s[1]; for k:2 step 1 while k<7 do (n[k]:s[k]-s[k-1]); |
| (%i14) | ss:n[5]; |
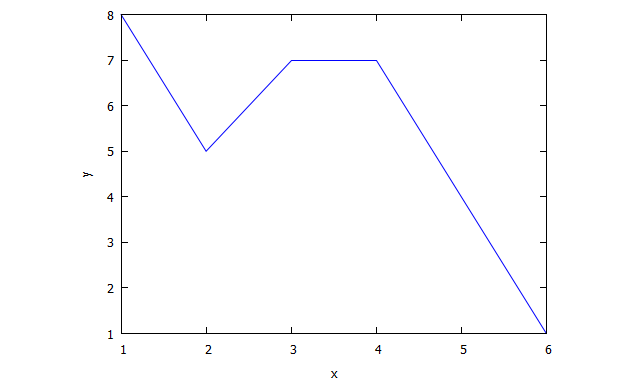
| (%i16) |
xy: [[1, n[1]], [2, n[2]], [3, n[4]], [4, n[4]], [5, n[5]], [6, n[6]]]; plot2d([discrete, xy]); |
| (%i22) | B1:B+St; B2:B+2*St; B3:B+3*St; B4:B+4*St; B5:B+5*St; B6:B+6*St; |
| (%i23) |
draw2d( key = "Group A", fill_color = blue, fill_density = 0.2, bars([B1,8,2],[B2,5,2],[B3,7,2],[B4,7,2],[B5,4,2],[B6,1,2]), xaxis = true ) $ |
Риc. 1.
| (%i24) | smin(mm); |
| (%i25) | smax(mm); |
| (%i26) | range(mm); |
| (%i27) | var1(mm); |
| (%i28) | std1(mm); |
| (%i29) | histogram(mm, nclasses = 6, fill_color= blue, fill_density = 0.5 , line_width = 4); |
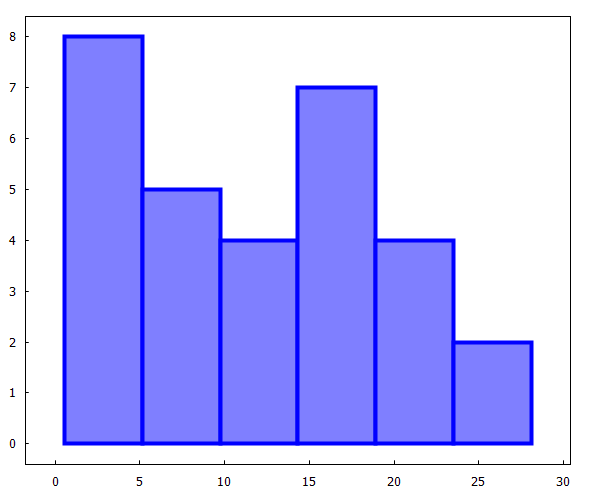
Риc. 2.