\( \DeclareMathOperator{\abs}{abs} \newcommand{\ensuremath}[1]{\mbox{$#1$}} \)
Метод ітерацій (Method of iterations)
| (%i1) | kill(all); |
\[\]\[\tag{%o0} \ensuremath{\mathrm{done}}\]
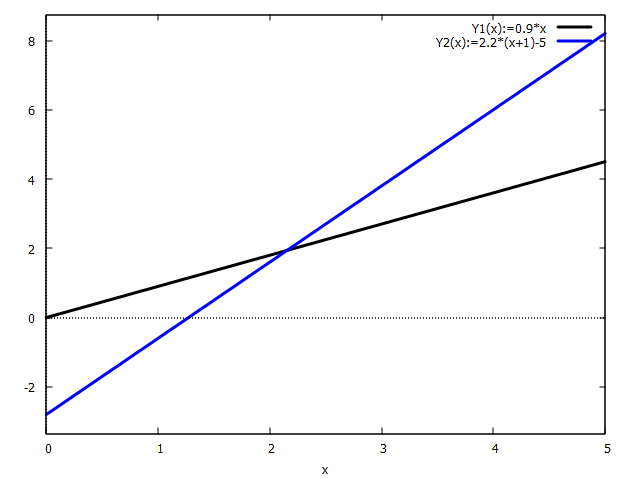
| (%i1) | Y1(x):=0.9·x; |
\[\]\[\tag{%o1} \mathop{Y1}(x)\mathop{:=}0.9 x\]
| (%i2) | Y2(x):=2.2·(x+1)−5; |
\[\]\[\tag{%o2} \mathop{Y2}(x)\mathop{:=}2.2 \left( x\mathop{+}1\right) \mathop{-}5\]
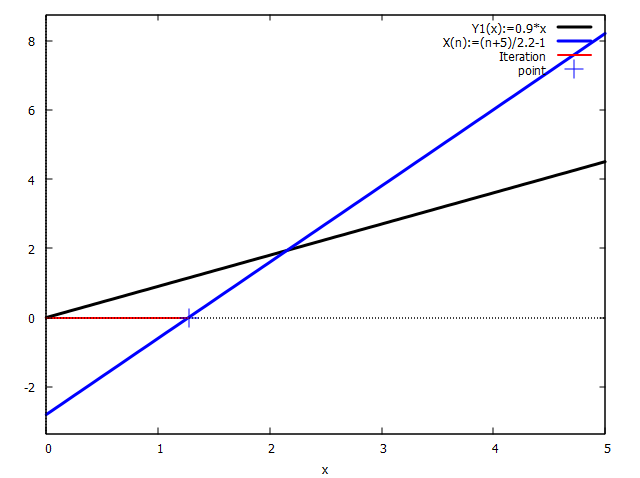
| (%i3) | X(n):=((n+5)/2.2)−1; |
\[\]\[\tag{%o3} \mathop{X}(n)\mathop{:=}\frac{n\mathop{+}5}{2.2}\mathop{-}1\]
| (%i4) | R(x):=Y1(x)−Y2(x); |
\[\]\[\tag{%o4} \mathop{R}(x)\mathop{:=}\mathop{Y1}(x)\mathop{-}\mathop{Y2}(x)\]
| (%i5) |
plot2d([Y1(x),Y2(x)],[x,0,5], [legend, "Y1(x):=0.9·x","Y2(x):=2.2·(x+1)-5"], [style, [lines, 3,5], [lines, 3,1]]); |
\[\]\[\tag{%o5} false\]
| (%i6) | delta:0.1; |
\[\]\[\tag{%o6} 0.1\]
| (%i7) | x_start:0; |
\[\]\[\tag{%o7} 0\]
| (%i8) | x1[0]:x_start; |
\[\]\[\tag{%o8} 0\]
| (%i10) | Y1[0]:Y1(x1[0]);x2[0]:X(Y1[0]); |
\[\]\[\tag{%o9} 0\]
\[\]\[\tag{%o10} 1.2727272727272725\]
| (%i11) | if (Y1(x2[0])−Y2(x2[0])<delta)then display("OK")else display(Y1(x2[0])−Y2(x2[0])); |
\[\]\[1.1454545454545453\mathop{+}-0.0\mathop{=}1.1454545454545453\]
\[\]\[\tag{%o11} \ensuremath{\mathrm{done}}\]
| (%i13) | x2[0];Y2(x2[0]); |
\[\]\[\tag{%o12} 1.2727272727272725\]
\[\]\[\tag{%o13} 0.0\]
| (%i14) |
plot2d([Y1(x),Y2(x),[discrete,[x1[0],x2[0]],[Y1(x1[0]),Y2(x2[0])]], [discrete,[x2[0]],[Y2(x2[0])]]],[x,0,5], [legend, "Y1(x):=0.9·x","X(n):=(n+5)/2.2-1", "Iteration", "point"], [style, [lines, 3,5], [lines, 3,1], [lines, 2,2], [points,6,1 ]]); |
\[\]\[\tag{%o14} false\]
Command FOR
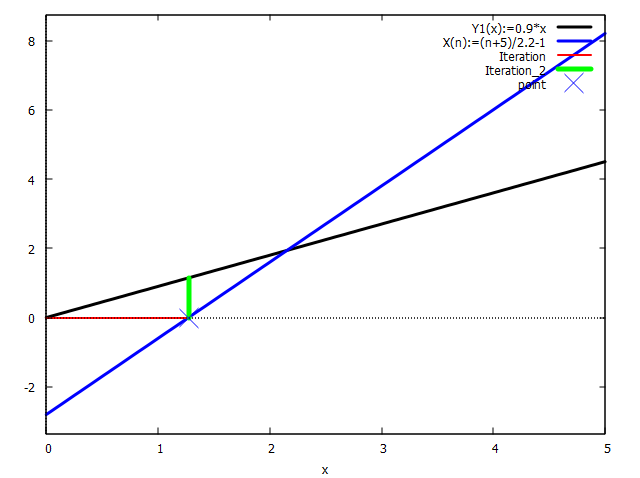
| (%i15) | delta:0.01; |
\[\]\[\tag{%o15} 0.01\]
| (%i17) |
x_start:0;for i:1 thru 6 step 1 do (x1[i]:x_start,Y1[i]:Y1(x1[i]),x2[i]:X(Y1[i]), if (Y1(x2[i])−Y2(x2[i])<delta)then display("OK")else (del:Y1(x2[i])−Y2(x2[i]),display(del)),x_start:x2[i],display(x2[i]), plot2d([Y1(x),Y2(x),[discrete,[x1[i],x2[i]],[Y1(x1[i]),Y2(x2[i])]], [discrete,[x2[i],x2[i]],[Y1(x2[i]),Y2(x2[i])]], [discrete,[x2[i]],[Y2(x2[i])]]],[x,0,5], [legend, "Y1(x):=0.9·x","X(n):=(n+5)/2.2-1", "Iteration","Iteration_2", "point"], [style, [lines, 3,5], [lines, 3,1], [lines, 2,2],[lines, 5,3], [points,6,1 ]]))$ |
\[\]\[\tag{%o16} 0 \]\[\ensuremath{\mathrm{del}}\mathop{=}1.1454545454545453 \]\[{{\ensuremath{\mathrm{x2}}}_1}\mathop{=}1.2727272727272725 \]\[\ensuremath{\mathrm{del}}\mathop{=}0.46859504132231455 \]\[{{\ensuremath{\mathrm{x2}}}_2}\mathop{=}1.7933884297520657 \]\[\ensuremath{\mathrm{del}}\mathop{=}0.1916979714500373 \]\[{{\ensuremath{\mathrm{x2}}}_3}\mathop{=}2.006386175807663 \]\[\ensuremath{\mathrm{del}}\mathop{=}0.07842189741137884 \]\[{{\ensuremath{\mathrm{x2}}}_4}\mathop{=}2.093521617375862 \]\[\ensuremath{\mathrm{del}}\mathop{=}0.03208168530465527 \]\[{{\ensuremath{\mathrm{x2}}}_5}\mathop{=}2.129167934381034 \]\[\ensuremath{\mathrm{del}}\mathop{=}0.01312432580644951 \]\[{{\ensuremath{\mathrm{x2}}}_6}\mathop{=}2.143750518610423\]
| --> | for i:1 thru 6 step 1 do display(x2[i]); |
\[\]\[{{\ensuremath{\mathrm{x2}}}_1}\mathop{=}1.2727272727272725 \]\[{{\ensuremath{\mathrm{x2}}}_2}\mathop{=}1.7933884297520657 \]\[{{\ensuremath{\mathrm{x2}}}_3}\mathop{=}2.006386175807663 \]\[{{\ensuremath{\mathrm{x2}}}_4}\mathop{=}2.093521617375862 \]\[{{\ensuremath{\mathrm{x2}}}_5}\mathop{=}2.129167934381034 \]\[{{\ensuremath{\mathrm{x2}}}_6}\mathop{=}2.143750518610423\]
\[\]\[\tag{%o18} \ensuremath{\mathrm{done}}\]
| (%i18) |
plot2d([Y1(x),Y2(x), [discrete,[x1[1],x2[1]],[Y1(x1[1]),Y2(x2[1])]], [discrete,[x2[1],x2[1]],[Y1(x2[1]),Y2(x2[1])]], [discrete,[x2[1]],[Y2(x2[1])]] ],[x,0,5], [legend, "Y1(x):=0.9·x","X(n):=(n+5)/2.2-1", "Iteration","Iteration_2", "point"], [style, [lines, 3,5], [lines, 3,1], [lines, 2,2],[lines, 5,3], [points,6,1 ]])$ |
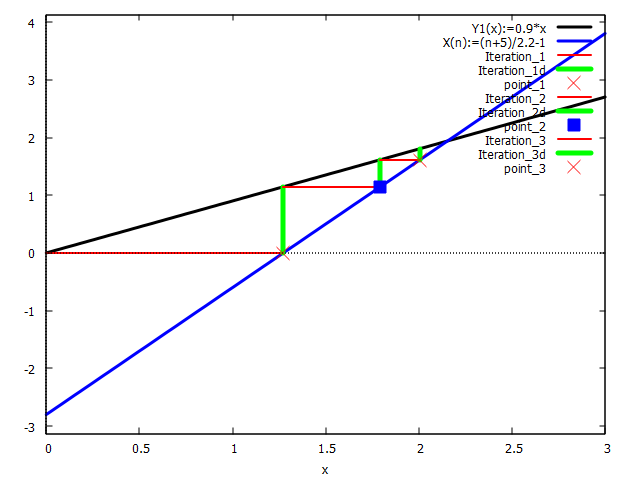
| (%i19) |
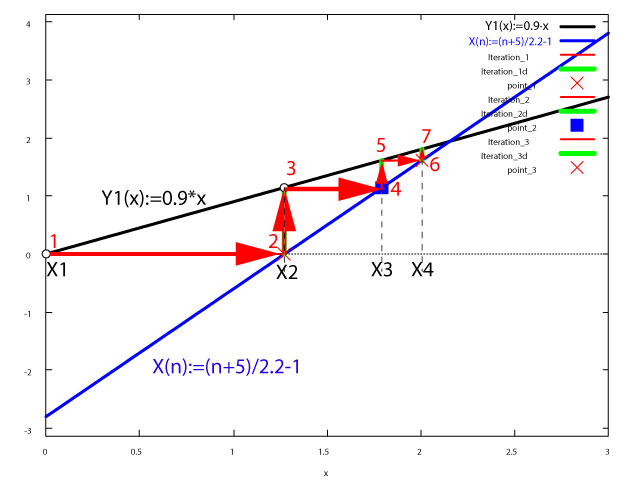
plot2d([Y1(x),Y2(x), [discrete,[x1[1],x2[1]],[Y1(x1[1]),Y2(x2[1])]], [discrete,[x2[1],x2[1]],[Y1(x2[1]),Y2(x2[1])]], [discrete,[x2[1]],[Y2(x2[1])]], [discrete,[x1[2],x2[2]],[Y1(x1[2]),Y2(x2[2])]], [discrete,[x2[2],x2[2]],[Y1(x2[2]),Y2(x2[2])]], [discrete,[x2[2]],[Y2(x2[2])]], [discrete,[x1[3],x2[3]],[Y1(x1[3]),Y2(x2[3])]], [discrete,[x2[3],x2[3]],[Y1(x2[3]),Y2(x2[3])]], [discrete,[x2[3]],[Y2(x2[3])]] ],[x,0,3], [legend, "Y1(x):=0.9·x","X(n):=(n+5)/2.2-1", "Iteration_1","Iteration_1d", "point_1", "Iteration_2","Iteration_2d", "point_2", "Iteration_3","Iteration_3d", "point_3"], [style, [lines, 3,5], [lines, 3,1], [lines, 2,2],[lines, 5,3], [points,4,2 ],[lines, 2,2],[lines, 5,3], [points,4,7 ] ,[lines, 2,2],[lines, 5,3], [points,4,2 ]])$ |
| --> | maxima_tempdir; |
\[\]\[\tag{%o21} "C:/Users/y/AppData/Local/Temp"\]
Created with wxMaxima.
The source of this Maxima session can be downloaded here.